
If you’re looking to display your data in a more engaging and informative way, then you may want to consider using a data visualization plugin. There are many different plugins available, so it can be hard to know which is the best one for your needs. In this post, we will help you find the best WordPress data visualization plugin that will let you transform boring data into everything from charts, graphs, interactive images, infographics, etc.
Table of Contents
Best WordPress Data Visualization Plugin
wpDataTables – Tables and Charts Manager for WordPress
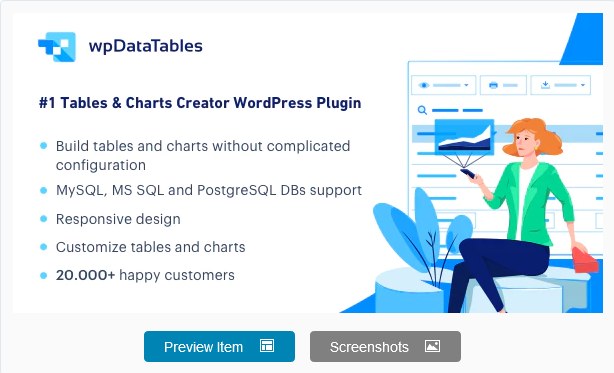
wpDataTables is an easy-to-use and powerful data visualization plugin that lets you easily create interactive tables, charts, and graphs from any MySQL database table on your WordPress website. Whether you want to display survey results or sales figures, track visitors statistics or show product inventory – wpDataTables will help you get the job done in minutes
There are many WordPress data visualization plugins available, but wpDataTables is the best. It includes all of the features you need to create interactive tables with filtering, sorting, and pagination capabilities rendered by the powerful DataTables library.
wpDataTables allows you to create beautiful and interactive tables, and it’s also extremely customizable so you can change almost every aspect of how your tables look and work. And you don’t have to be an expert coder or designer to use this tool; anyone who’s able to use WordPress will find it easy to get started with wpDataTables right away.
Plus, with wpDataTables charts and tables can be updated in real-time, making it easy to see changes as they happen in your database, Google Sheets, or any other supported data source. And front-end and back-end editing of MySQL-based tables make changing data easier than ever before.
If you are looking for an intuitive and feature-rich way to visualize your data online then look no further than wpDataTables. With years of development behind it, the team at wpDataTables has created the go-to data visualization plugin with more features than any other similar plugin out there.
UberChart – WordPress Chart Plugin
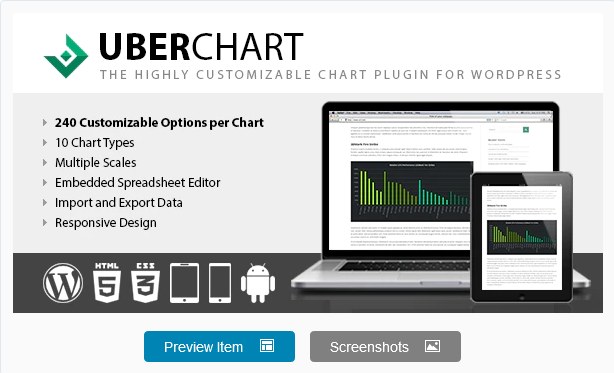
The UberCharts WordPress Chart Plugin makes it easy to build professional-looking data visualizations on your website using an intuitive drag-and-drop interface that anyone can use. This plugin has over 10 different types of charts including line, bar, area, horizontal bar, pie, doughnut and radar charts, and everything in between. And if you need more control over your data, then you can use the built-in spreadsheet editor which allows you to import CSV files directly into the plugin for instant visualizations. You can also add custom CSS styles if desired via the theme editor as well if you want to create charts and tables that follow your brand’s style guide.
Graphina Pro – Elementor Dynamic Charts, Graphs, & Datatables
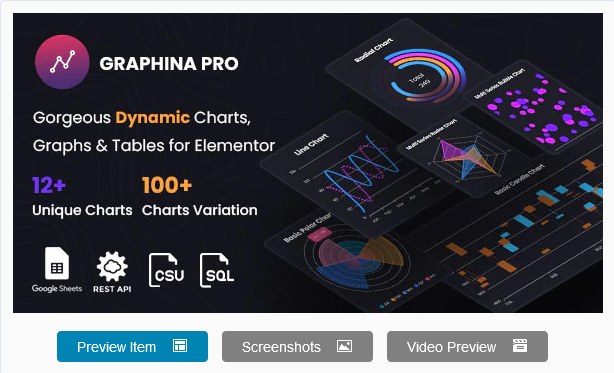
Graphina Pro allows you to create 12 different types of charts or graphs including line, column, pie, donut, radar, and more You can also use the dynamic real-time data functionality to display your Google Sheets data directly on your site using widgets like the Dynamic Chart Widget or the Dynamic Pie Chart Widget. Even better – these widgets are responsive so they will scale automatically on PC, tablet, and smartphone screens.
Infographic Maker – iList Pro

With iList Pro, you can create beautiful infographics directly from the WordPress backend in just a few clicks. No need to use external tools or hire an infographic designer. And the infographics are responsive and editable so they can be viewed on any device without having to pinch-to-zoom or scroll left and right.
iList Pro makes creating stunning data visualizations in WordPress easy and it comes with premade templates, or you can create a custom template from scratch. And you can fill your infographics with any type of content you like (images, video embeds, etc.)
Then once you’re happy with how everything looks just click “Publish” to make your infographic immediately available online. And best of all, your visitors can even share each element in the infographic if they want to spread the word about the information they found on your site.
Plus, iList Pro is one of the best WordPress data visualization plugins since it makes it easy to create charts and graphs with just a few clicks, whether you want a pie chart, bar chart, line chart, polar area chart, or radar chart. And iList Pro uses ChartJS which means your charts will look sharp no matter what kind of screen they are being displayed on.
Graphist – Graphs & Charts for Elementor
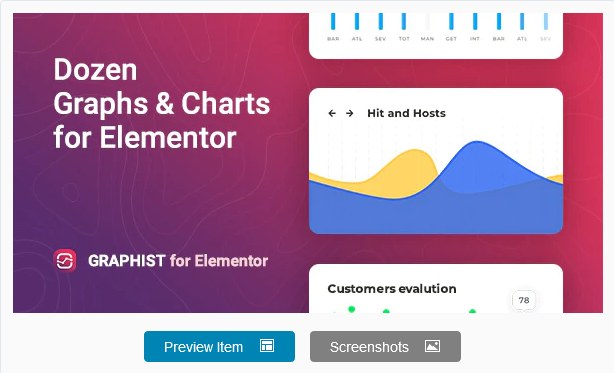
Graphist is the perfect solution for anyone who wants to add beautiful graphs & charts on their website using the Elementor page builder. With this plugin, you can choose from 12 different chart types including bar charts, line charts, area charts, and pie charts among others. Each type has its own set of customizable settings like colors, borders, margins, and padding, so you can make sure each graph looks exactly how you want it to look in every browser size – even on mobile devices.
Premium Charts for Elementor
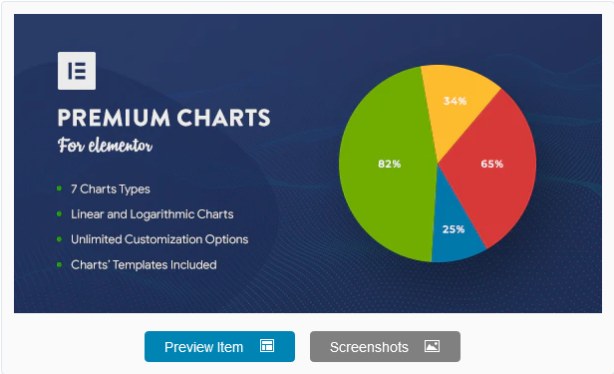
Premium Charts for Elementor lets you create all kinds of beautiful data visualizations using your existing content in just minutes. This way, instead of creating complex tables or graphs by hand and dealing with the hassle of exporting and importing data into different programs, you can simply insert an Elementor widget on any page or post.
With this plugin, you’ll be able to choose from seven unique types of charts (Pie Chart, Doughnut Chart, Polar Area Chart, Line Chart, Vertical Bar Chart, Horizontal Bar Chart & Radar Charts) and each chart has unlimited customization options such as colors schemes/styles/labels, etc.
Charts and graphs WordPress Visual Designer
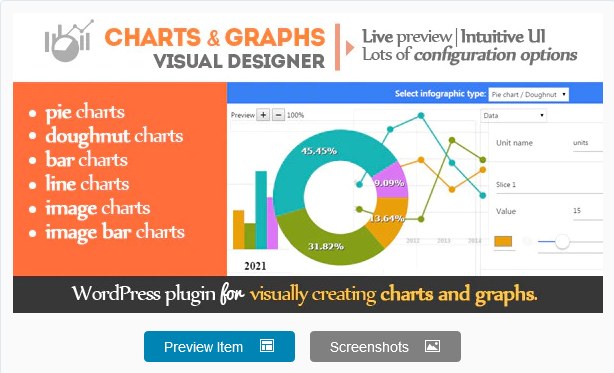
The Charts and Graphs Plugin for WordPress makes it easy for anyone to create stunning charts in their WordPress blog or website. With this plugin, you can easily integrate charts into your posts and pages with just a few clicks of the mouse. This is perfect for bloggers who want to include more information in their content without having to do any coding themselves.
This Plugin has lots of chart types available including pie charts, line graphs, bar graphs (vertical/horizontal), doughnut (pie) charts, bubble diagrams, etc… You can also customize all aspects of these charts using the robust configuration options available under each chart type settings page.
DW Chart – WordPress Plugin
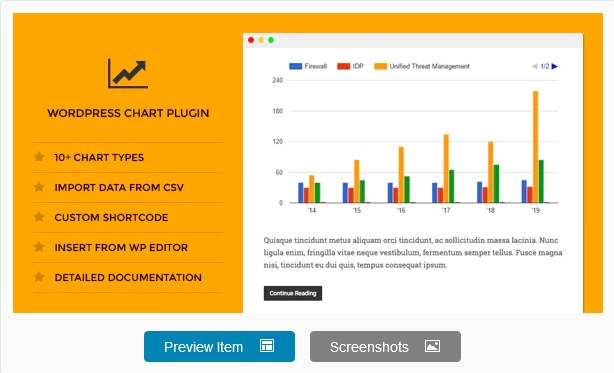
DW Chart features 10 different types of charts, from basic bar graphs to more complicated geo-charts or trendlines. And with this plugin you can import and export data manually or by using CSV files, giving you more options to work with data from multiple sources on and off your site.
WP Timeline – Vertical and Horizontal timeline plugin
WP Timeline allows you to create professional-looking timelines with ease. It has all the features you need for any project where you need to create sequential stories/timelines/histories. And this data visualization plugin is perfect for history websites, or it can be used to document the development or progress of a person, product, company, or team.
Vision Interactive – Image Map Builder for WordPress
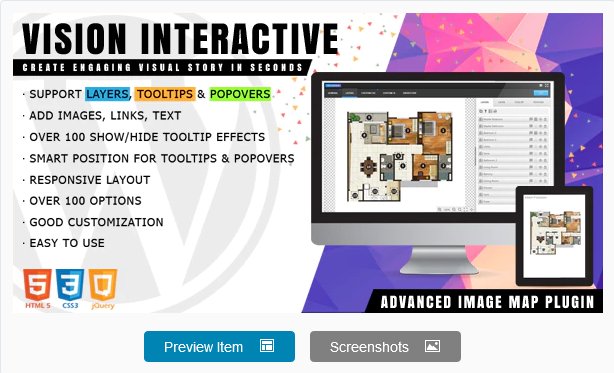
Vision Interactive is the best plugin for WordPress data visualization, with it you can easily annotate images with text, shapes, icons, draw attention to areas and features on images. It also provides an easy way for you to convert a static image into online interactive media brochures or booklets, image maps, floor plans, family trees, etc in seconds without any coding knowledge required.